Somewhere on your after-visit summary, or buried in the portal note you finally got around to reading, there may be a line that says something like MNSI 3.5 or TCNS 8 or UENS 14.
No context. No range. No explanation of whether that’s good, bad, or unremarkable.
I’ve had readers send me screenshots of exactly that line, asking what it means, because searching the acronym drops you straight into validation studies full of sensitivity percentages and receiver operating curves. Nobody writes the plain version.
So this is the plain version. What these three scores are, how each one is built, what your number sits inside, and — the part that turns out to matter most — what they were designed to do that a single reading can’t do at all.
Why These Scores Exist
Neuropathy is difficult to measure. “Burning” and “numb” and “worse lately” are real, but they don’t compare well between two people, between two visits, or between two clinics.
Standardized scoring instruments exist to convert that into something countable. Each one prescribes a fixed set of questions and physical checks, assigns points by defined rules, and produces a total. The point isn’t that the number captures your experience — it doesn’t, and no honest researcher claims otherwise. The point is that it’s consistent. The same procedure applied twice produces two numbers you can legitimately compare.
All three of the common instruments were developed and validated primarily in diabetic neuropathy, which shapes what they’re good at. They’re used more widely than that, but their sharpest evidence base sits with diabetic peripheral neuropathy.
The MNSI: Michigan Neuropathy Screening Instrument
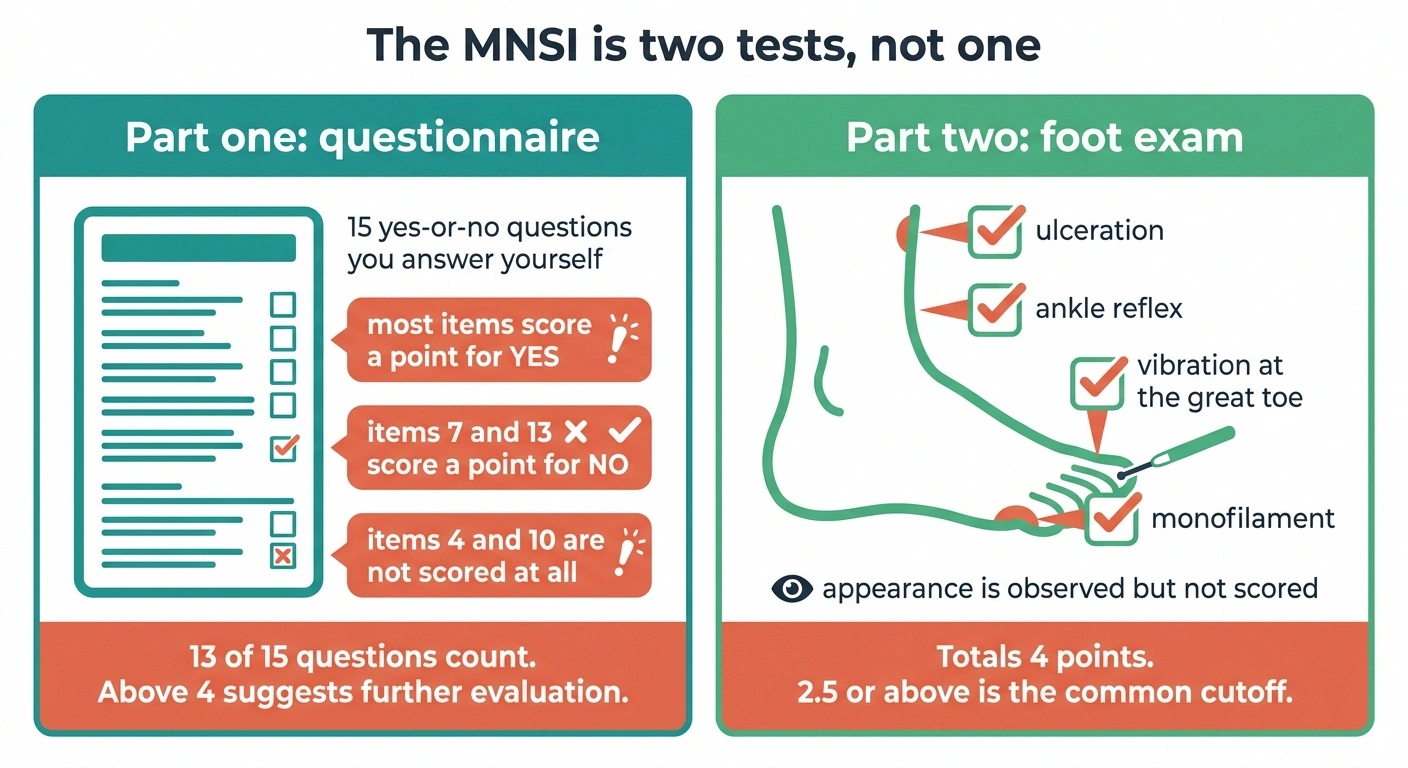
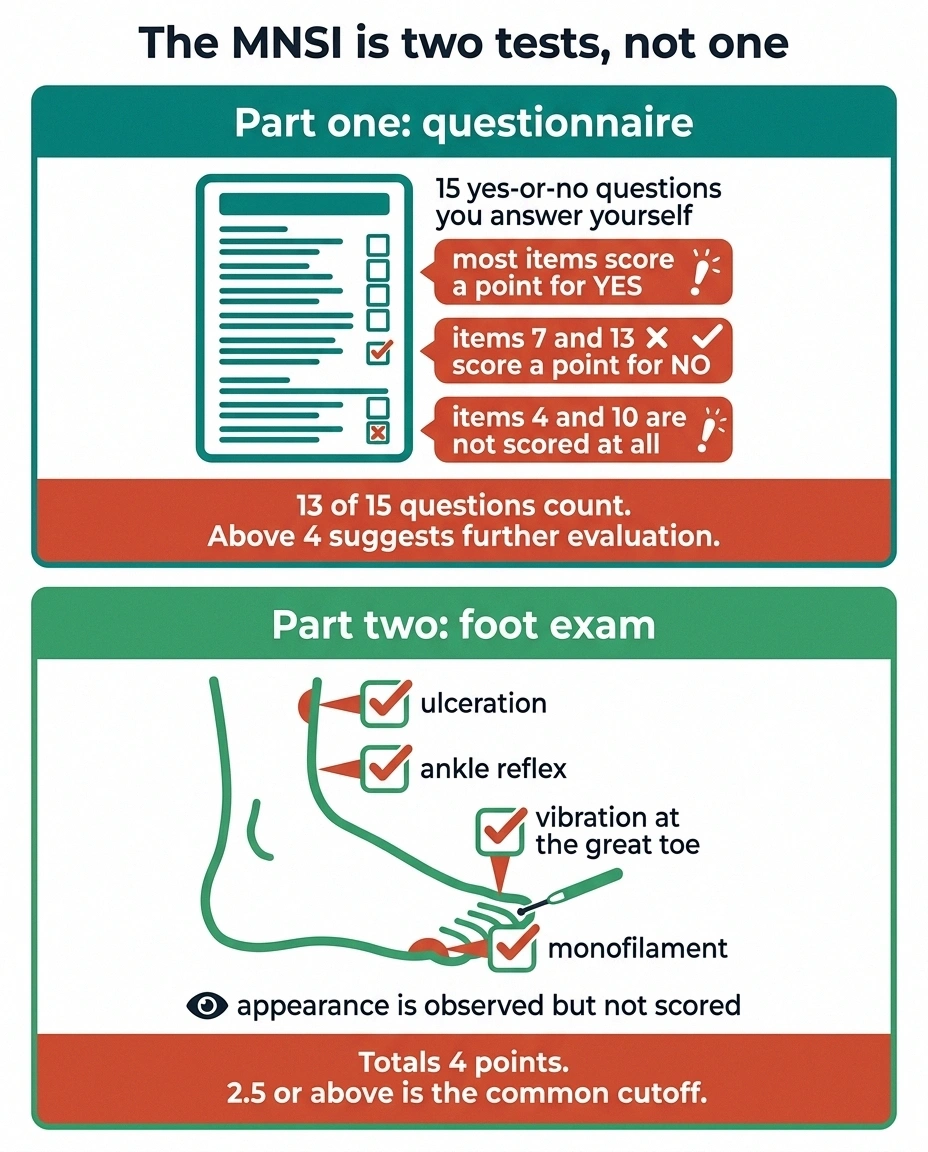
The MNSI is the one you’re most likely to encounter, and it’s the most commonly misread, because it’s really two separate tests reported under one name.
If you fill out the MNSI questionnaire yourself and try to total it, you will probably get the wrong number, because two items run backwards and two do not count at all.
- Items 7 and 13 score a point for answering no, not yes. They are phrased in the opposite direction from the rest.
- Item 4 asks about circulation and item 10 asks about general weakness. Both are recorded for clinical context and neither contributes to the total.
So fifteen questions produce a maximum of thirteen points. If your own tally disagrees with the one in your chart by one or two, this is almost always why.
Part one: the questionnaire
Fifteen yes-or-no questions you answer yourself, about numbness, burning, sensitivity, cramping, weakness, and whether you can tell hot water from cold with your feet.
The scoring has a quirk worth knowing about. Most items score a point for yes. Two of them — items 7 and 13 — score a point for no, because they’re phrased in the reverse direction. And two items aren’t scored at all: item 4 asks about circulation and item 10 asks about general weakness, and both were kept for clinical context rather than counted toward the total. So thirteen of the fifteen questions actually contribute points.
A frequently cited threshold is that a questionnaire score above 4 suggests neuropathy warranting further evaluation.
Part two: the foot exam
A clinician performs four checks per foot:
Appearance. Deformity, dry skin, callus, hair or nail changes, infection. This is observed and recorded, and in the standard scoring it doesn’t earn points.
Ulceration. One point if an ulcer is present on either foot. If this applies to you, the ulcer itself matters far more than the score, and our guidance on managing diabetic foot ulcers is the more urgent read.
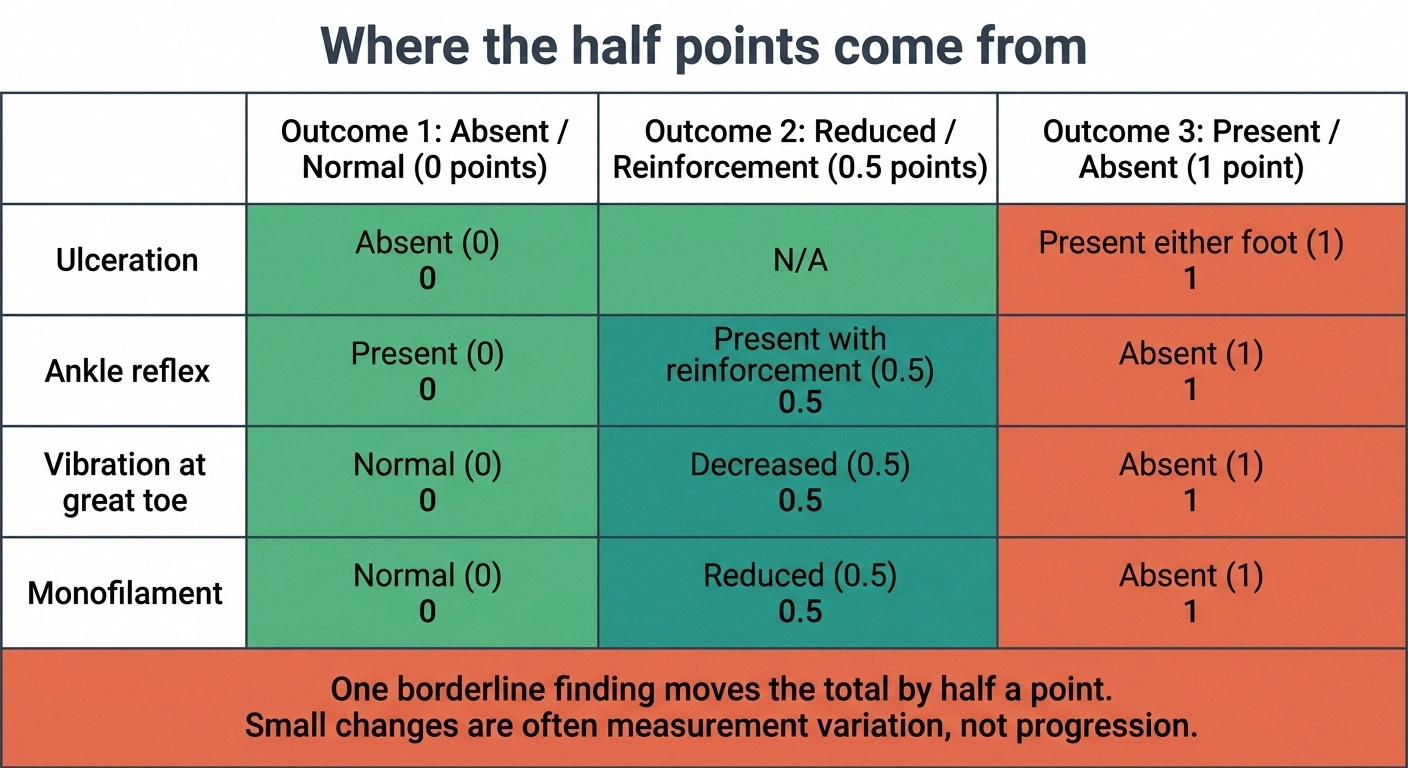
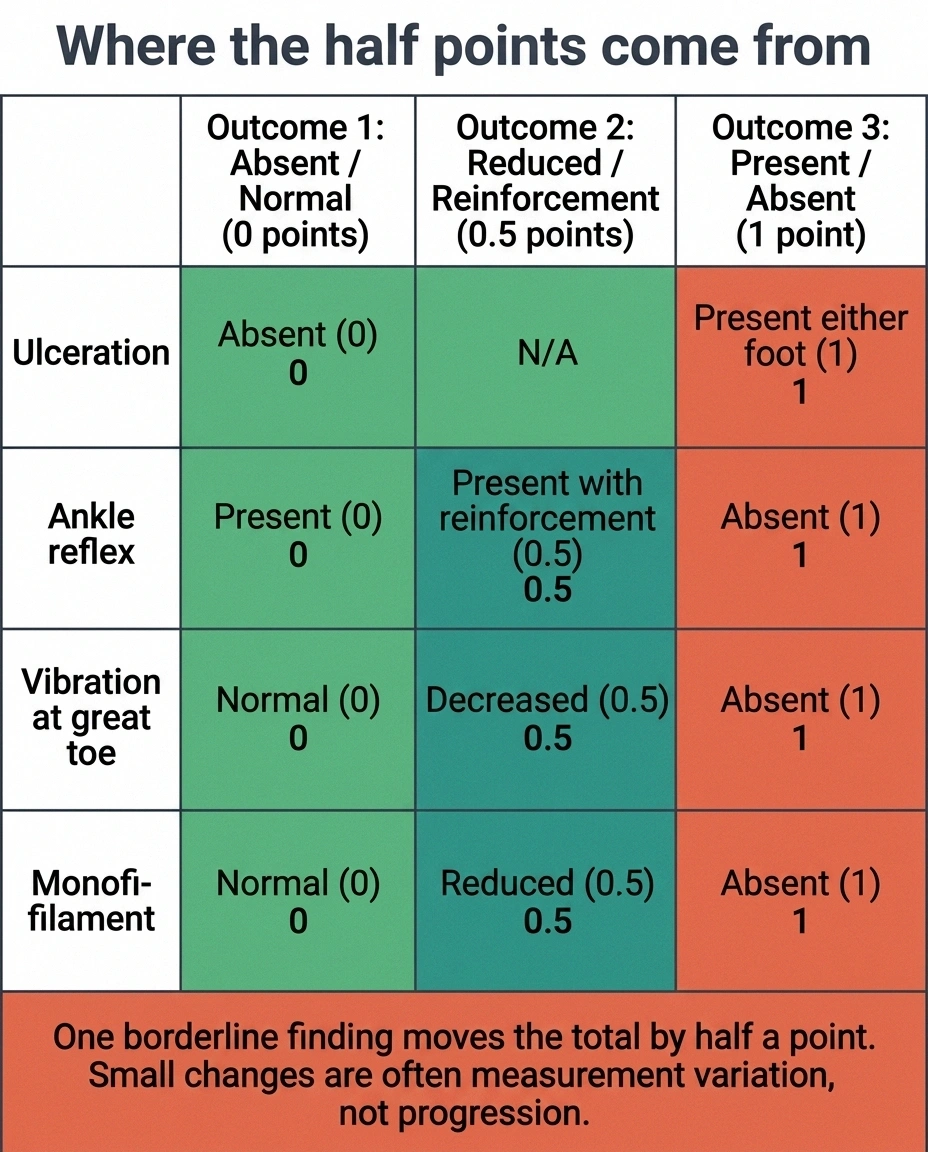
Ankle reflex. Half a point if the reflex only appears with reinforcement (the maneuver where you’re asked to hook your fingers together and pull). A full point if it’s absent.
Vibration at the great toe. A tuning fork on the top of the big toe. Half a point if reduced, a full point if absent.
Monofilament. The nylon filament pressed against the sole until it buckles. Half a point if the response is reduced, a full point if absent.
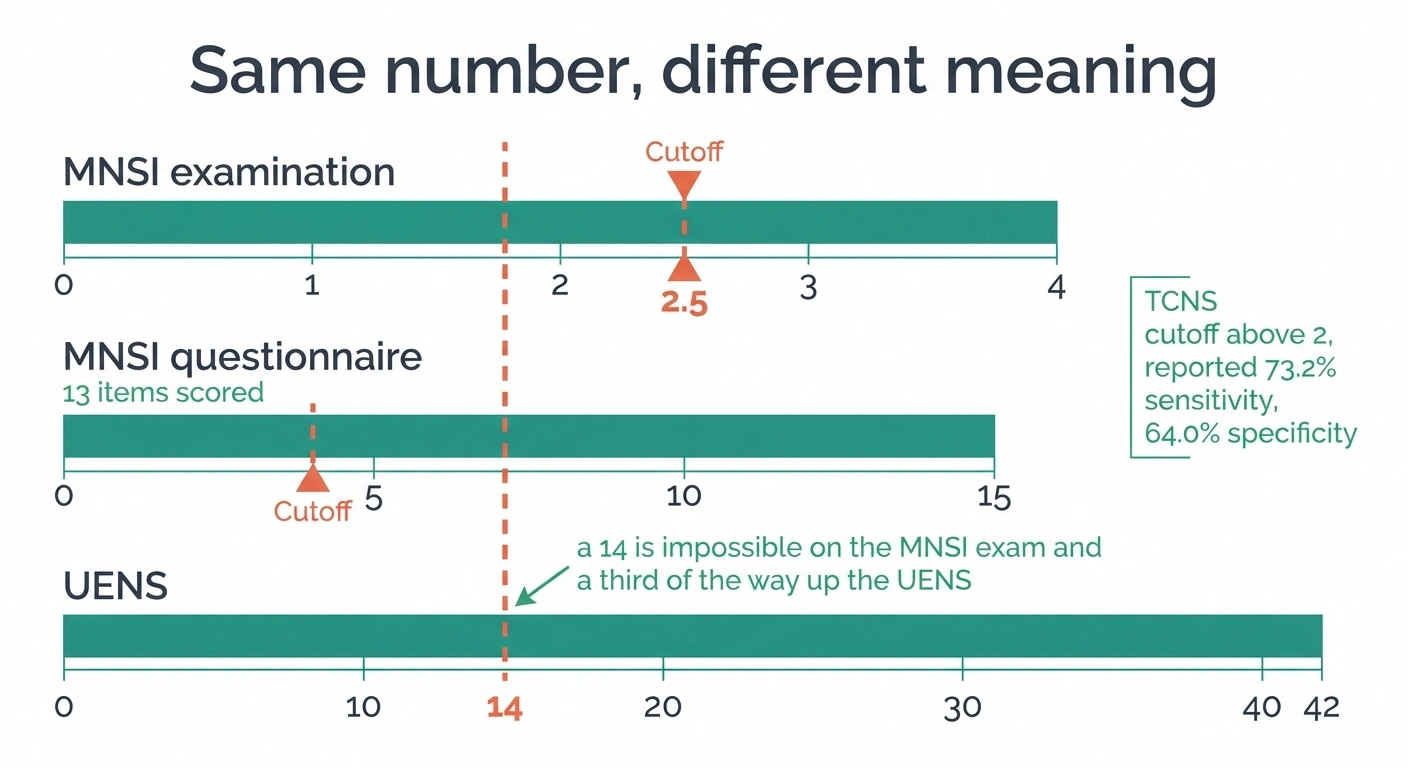
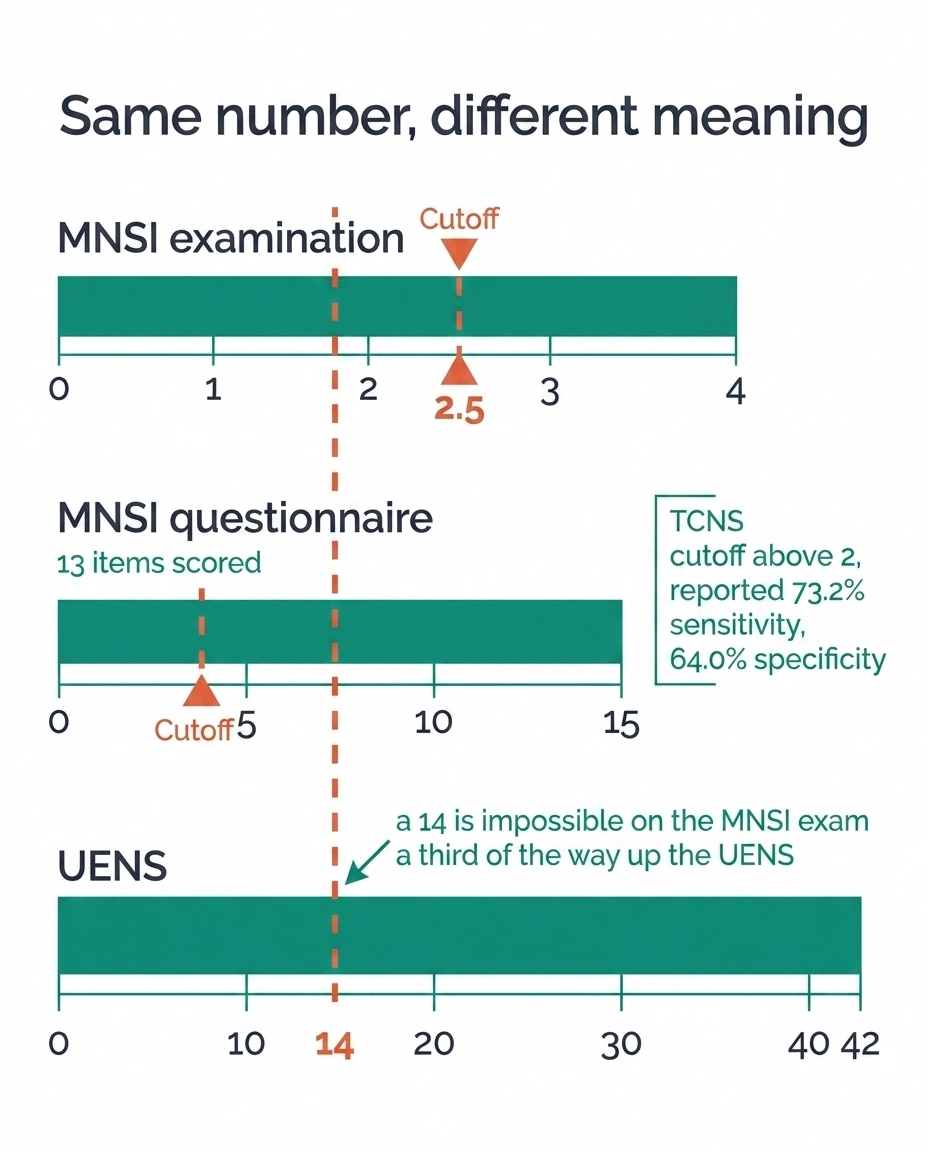
The standard exam totals 4 points, and a score of 2.5 or above is the commonly used cutoff for probable neuropathy. Some published versions expand the exam to 8 or 10 points, which is precisely why an unlabeled number causes confusion. Always ask which scale the number belongs to.
The cutoff is genuinely unsettled
Here’s something the literature is open about but clinical notes never mention: the optimal MNSI cutoff is contested. Published proposals include 1.5, 2, 2.5, 3, and 4. One study reported that a cutoff above 2 yielded 96.8% sensitivity and 85.7% specificity for detecting diabetic peripheral neuropathy.
What this means for you is straightforward. A score sitting near any threshold is a judgment call, not a verdict. Being at 2.5 rather than 2.0 doesn’t flip you between two different realities.
The TCNS: Toronto Clinical Neuropathy Score
The Toronto score combines three domains into one total: symptom items, reflex testing, and sensory testing at the toe.
Its behavior differs from the MNSI in a way worth understanding. At a cutoff above 2, the TCNS has been reported at 73.2% sensitivity and 64.0% specificity. Both numbers are lower than the MNSI figures above, which sounds worse and isn’t exactly.
Lower specificity means more false positives — the test flags people who turn out not to have neuropathy on fuller workup. In a screening tool that’s often an acceptable trade, since a false alarm leads to another test while a missed case leads to nothing at all.
A modified version, the mTCNS, was developed and validated afterward with adjusted sensory items and demonstrated reliability in diabetic sensorimotor polyneuropathy. If your note says mTCNS, that’s the revised instrument, and its numbers aren’t directly interchangeable with the original.
The UENS: Utah Early Neuropathy Scale
The UENS was built for a specific frustration: people with real early neuropathy whose standard screening scores keep coming back clean.
| Instrument | Range | Common cutoff | Reported performance | Best at |
|---|---|---|---|---|
| MNSI questionnaire | 0 to 15, with 13 items scored | Above 4 | Cutoff contested, proposals from 1.5 to 4 | Self-report screening at scale |
| MNSI examination | 0 to 4 in the standard version | 2.5 or above | At a cutoff above 2: 96.8% sensitivity, 85.7% specificity | Quick clinical confirmation |
| TCNS | Symptoms, reflexes and sensory combined | Above 2 | 73.2% sensitivity, 64.0% specificity | Catching more cases, accepting false positives |
| UENS | 0 to 42 | Graded severity rather than a single cutoff | 91.7% sensitivity, 83.3% specificity | Early disease, when others read normal |
Performance figures come from separate validation studies in different populations, so they are not a head-to-head comparison. Treat them as a rough sense of each instrument’s character rather than a ranking.
Its design difference is the emphasis on pinprick sensation in the foot and, critically, how far up the leg the loss extends. Because length-dependent neuropathy creeps upward over time, the proximal boundary of pinprick loss carries information that a simple present-or-absent check at the toe throws away.
It runs 0 to 42, a much wider range than the other two, with higher scores meaning more severe disease. Reported performance is 91.7% sensitivity and 83.3% specificity, with the notable strength being detection at the early stage where other instruments still read normal.
The wide range is also why UENS numbers look alarming next to the others. A 14 on the UENS and a 14 on a 4-point MNSI exam are not remotely the same statement. One is a third of the way up its scale; the other is impossible.
Reading Your Own Number Correctly
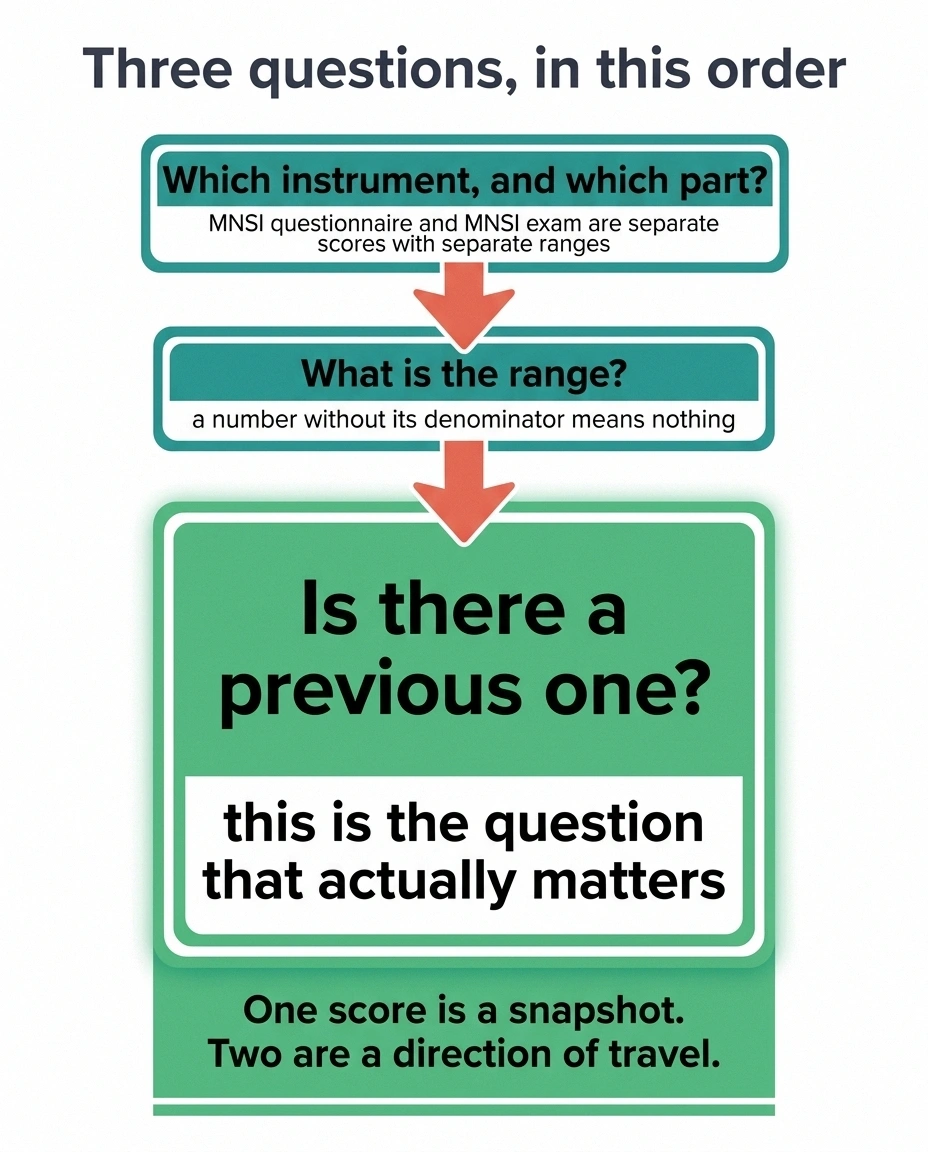
Three questions, in order, whenever you encounter one of these on paper.
- Sensitivity
- Of the people who genuinely have neuropathy, what share does this test flag. High sensitivity means few missed cases. A test at 91.7% sensitivity still misses roughly eight people in a hundred who have the condition.
- Specificity
- Of the people who do not have it, what share does this test correctly clear. High specificity means few false alarms. At 64% specificity, more than a third of unaffected people get flagged and go on to further testing that finds nothing.
- Why they trade against each other
- Lowering a cutoff catches more true cases and also more false ones. Raising it does the reverse. That is exactly why the MNSI cutoff is still argued over, with published proposals from 1.5 to 4. There is no setting that is simply correct; there is only a setting that fits the purpose.
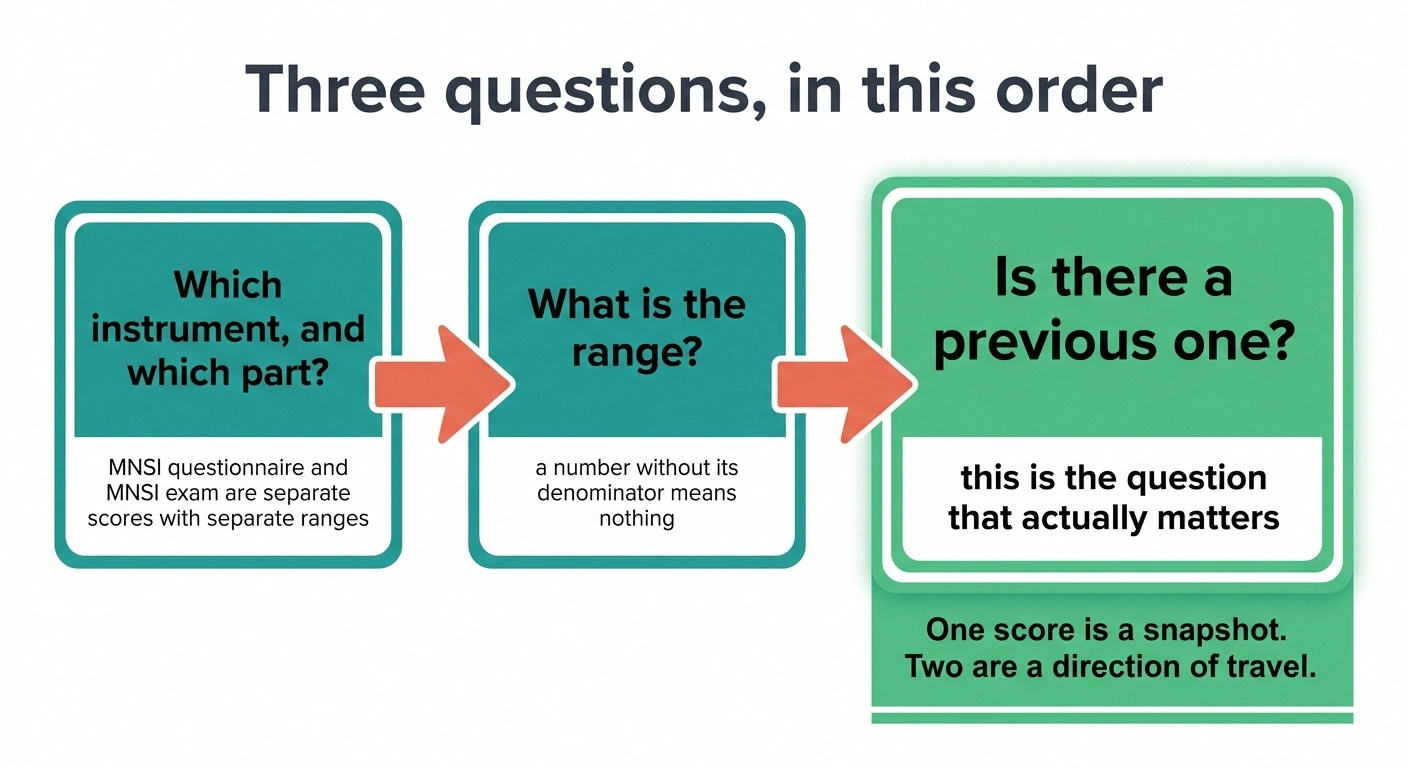
First: which instrument, and which part? MNSI questionnaire and MNSI exam are separate scores with separate ranges and separate cutoffs. This single ambiguity causes more confusion than anything else on this page.
Second: what’s the range? MNSI questionnaire runs to 15 with 13 scored items. MNSI standard exam runs to 4. TCNS and UENS have their own scales, with UENS reaching 42. A number without its denominator means nothing.
Third: is there a previous one? This is the question that actually matters, and I’ll spend the next section on why.
The Delta Is the Data

These instruments were designed to be repeated. That’s the whole point of standardizing them — the DCCT and EDIC studies used the MNSI to track thousands of people over years, and its value there was in the movement, not in any individual reading.
Copy this into whatever you already use. Four fields, thirty seconds, and it turns a series of isolated numbers into a trend nobody else is tracking for you.
Recording the range beside the score is what makes the log durable. In three years you will not remember whether that 2.5 came from a four-point exam or a ten-point variant, and without the range the number stops meaning anything.
One score tells you roughly where you are, filtered through a specific instrument’s assumptions, on a day when your feet may have been cold and the examiner may have been the resident rather than the attending. Two scores taken the same way twelve months apart tell you the direction of travel.
Direction of travel is the thing you can actually act on. It’s the difference between “I have neuropathy” and “my neuropathy has been stable for two years,” and those are different lives.
So the most useful thing you can do with a score is write it down. Date, instrument name, which part, the number. A single line in whatever you already keep. If you track your symptoms in a diary, add a scores section to it. When someone eventually asks how things have changed, you’ll have an answer that isn’t a guess.
What These Scores Are Not
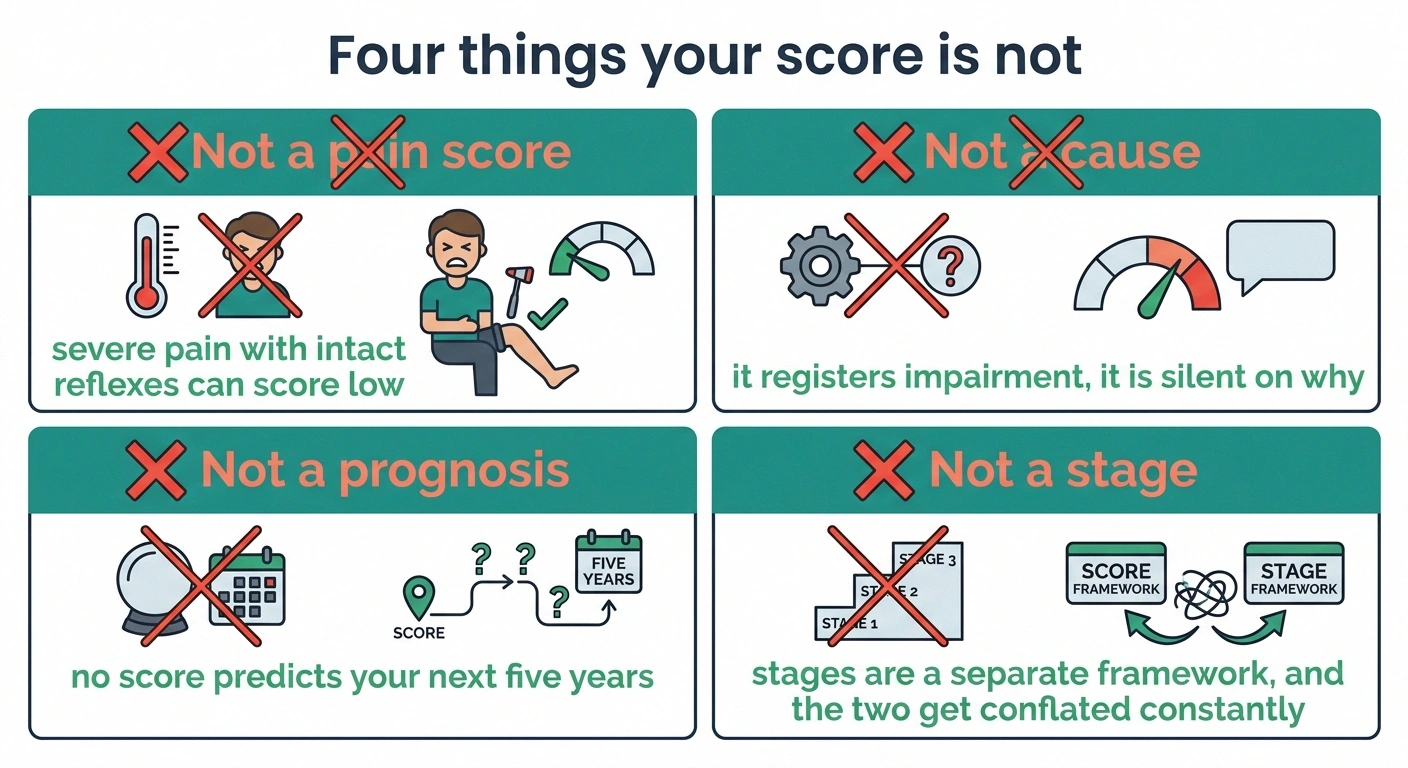
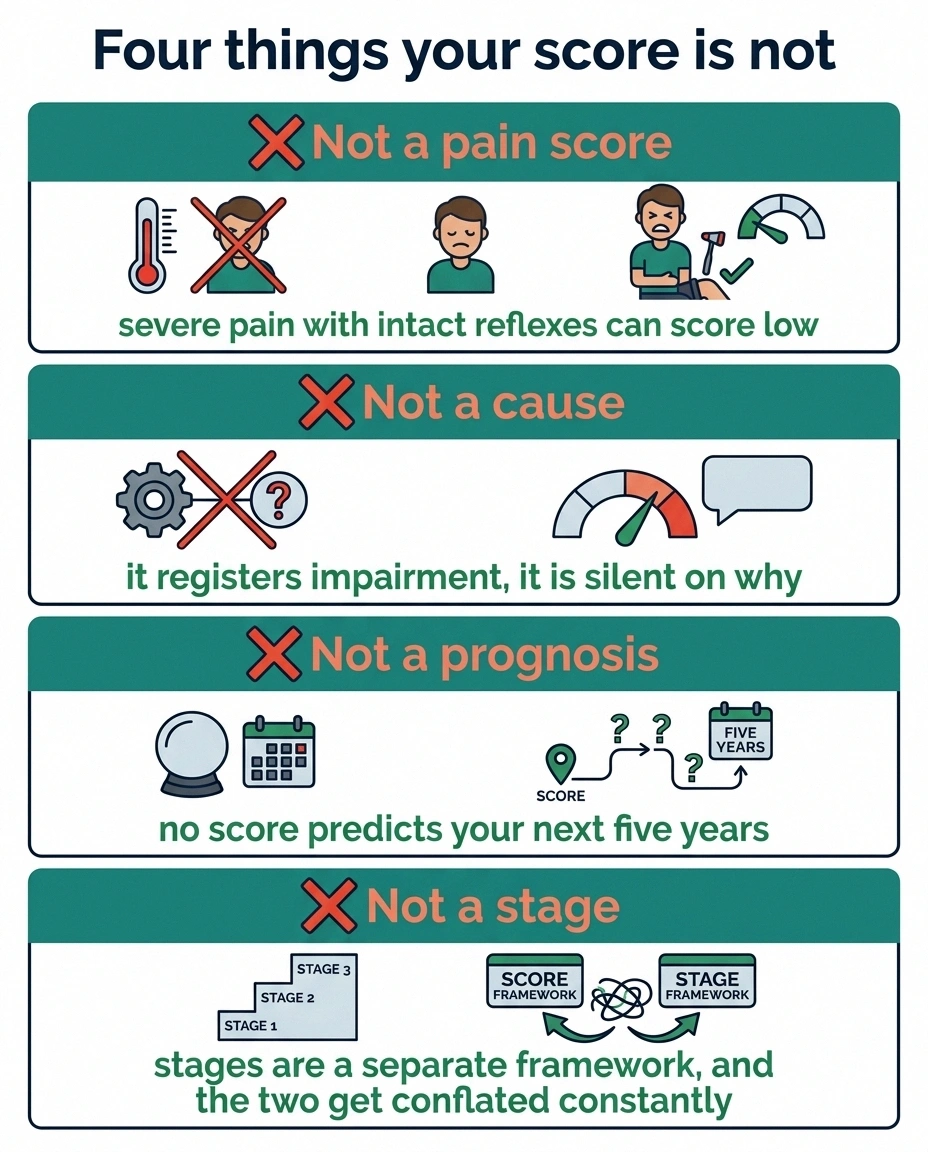
Four honest limits, because inflated expectations here cause real distress.
They are not pain scores. Nothing in the MNSI exam measures how much you hurt. Someone in severe pain with intact reflexes and normal vibration can score low. Someone comfortable with dense numbness can score high. A low score doesn’t say your pain is small.
They are not causes. They register that nerve function is impaired. They’re silent on why. The cause comes from history, examination, and the blood panel that screens for treatable contributors. For a substantial share of people the answer stays idiopathic regardless of the score.
They are not prognoses. No score predicts your next five years. They’re not built for it and the validation studies don’t claim it.
They are not stages. A score isn’t a stage number, and the two get conflated constantly. If you want the structural picture of how neuropathy tends to progress, the stages framework is a separate and more useful lens.
Bringing It Into an Appointment
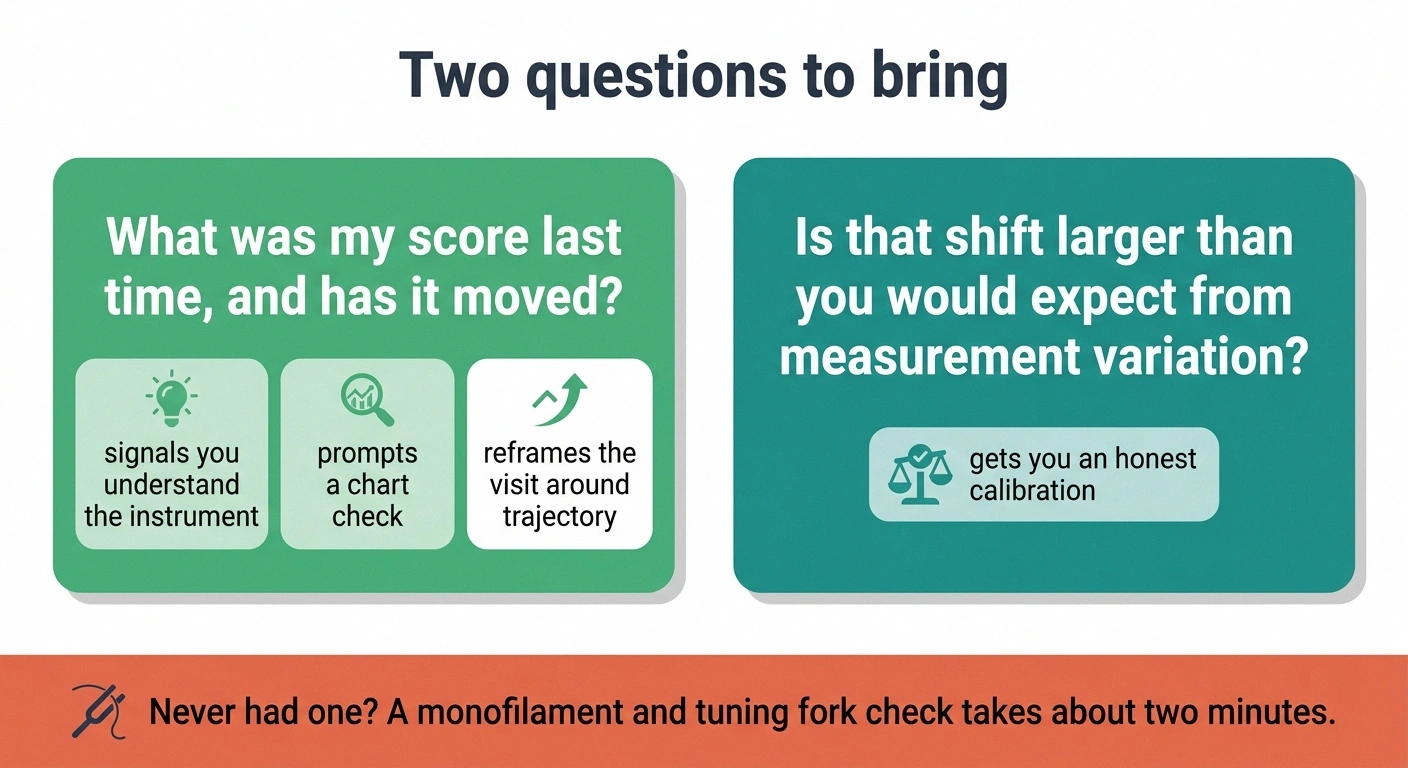
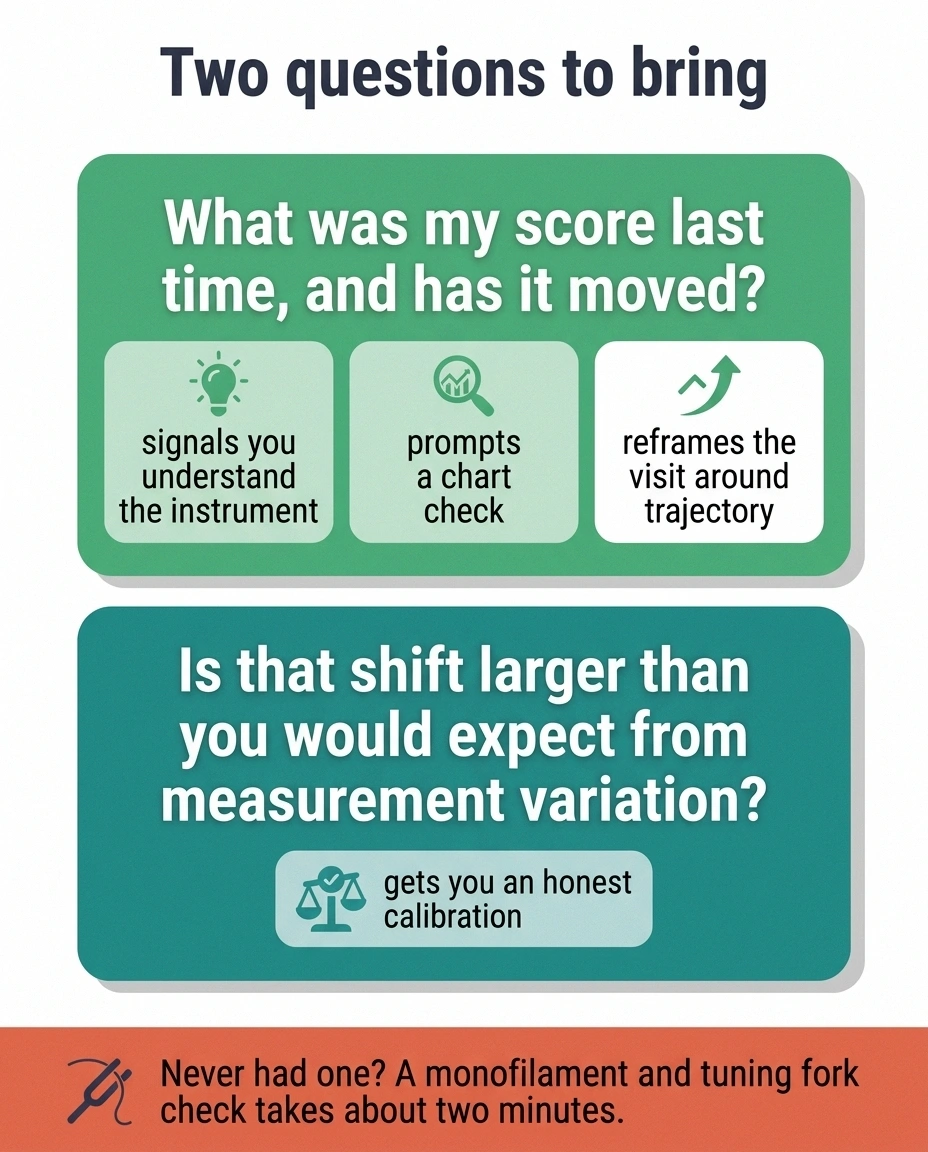
The most productive question isn’t “is my score bad.” It’s this: “What was my score last time, and has it moved?”
That question does three things at once. It signals you understand what the instrument is for. It prompts a look at the chart that might not otherwise happen. And it reframes the visit around trajectory instead of a single data point, which is where the useful conversation lives.
A reasonable follow-up, if a score has changed: “Is that shift larger than you’d expect from measurement variation?” Different examiners get slightly different results, and small movements can be noise. Asking directly gets you an honest calibration.
And if you’ve never had any of these done, that’s worth naming too. A monofilament and tuning fork check takes about two minutes and costs essentially nothing, and it’s the foundation that the rest of a neuropathy workup gets built on. Plenty of people have been managing symptoms for years without one on record.
Frequently Asked Questions
What is a bad MNSI score?
It depends on which part of the instrument produced it. On the self-administered questionnaire, which is scored out of 13 counted items across 15 questions, a score above 4 is commonly treated as suggesting neuropathy that warrants further evaluation. On the standard clinical examination, scored out of 4 points, a result of 2.5 or higher is the frequently used cutoff. The optimal threshold is genuinely debated in the research literature, with proposals ranging from 1.5 to 4, so a score sitting near a cutoff represents a judgment call rather than a definitive answer.
Does a normal score mean I do not have neuropathy?
No. These instruments are screening tools with imperfect sensitivity, meaning they miss some genuine cases. They rely heavily on large-fiber signs such as vibration sense and ankle reflexes, so small fiber neuropathy can be present with a normal or near-normal score. The Utah Early Neuropathy Scale was specifically developed to address this gap in early disease. Symptoms that persist despite a normal score justify continued evaluation rather than reassurance.
Why did my score change when I feel the same?
Several factors can shift a score without any real change in your condition. Different examiners apply the monofilament and tuning fork with slightly different technique, reflex testing is partly subjective, and skin temperature affects sensory testing so cold feet can alter results. Half-point items mean a single borderline finding moves the total. Small changes of half a point or one point are frequently within normal measurement variation, which is why asking whether a shift exceeds expected variation is a reasonable question.
Which neuropathy score is most accurate?
No single instrument is best for every purpose. The MNSI has the largest body of evidence and was used in major long-term diabetes studies including DCCT and EDIC. The Toronto Clinical Neuropathy Score, at a cutoff above 2, has been reported with lower specificity, meaning more false positives, which can be acceptable in screening. The Utah Early Neuropathy Scale performs best at detecting early disease, with reported sensitivity of 91.7% and specificity of 83.3%. The right choice depends on whether the goal is broad screening, confirming established disease, or catching early changes.
Can I score myself at home?
You can complete the MNSI questionnaire portion yourself, since it was designed as a self-administered instrument of yes-or-no questions. The examination portion requires equipment and technique that home use does not reliably reproduce, including a calibrated 10-gram monofilament, a 128 Hz tuning fork, and a reflex hammer used with correct positioning and reinforcement. A self-completed questionnaire score is useful information to bring to an appointment, but it does not substitute for the clinical examination and should not be used to rule anything out.
What is the difference between MNSI and mTCNS?
They are separate instruments with different structures and ranges. The MNSI combines a 15-item self-report questionnaire with a brief foot examination covering ulceration, ankle reflexes, vibration at the great toe, and monofilament testing. The modified Toronto Clinical Neuropathy Score is a revised version of the original Toronto scale, combining symptom scores, reflex scores, and sensory testing with adjusted sensory items, and it was separately validated for reliability in diabetic sensorimotor polyneuropathy. Their numbers are not interchangeable, so a total from one cannot be compared against a total from the other.
Do these scores affect insurance or disability claims?
They can appear as supporting documentation because they are standardized and reproducible, which makes them more persuasive than narrative symptom descriptions alone. However, no disability determination rests on one of these scores by itself. Functional impact matters more, including mobility, balance, fall history, and capacity to perform work-related activities. Serial scores documenting progression over time generally carry more weight than any single reading, which is another reason to keep your own record of dates and values.
Why does my score seem high compared to numbers I have seen online?
Almost always because the scales have different ranges. The Utah Early Neuropathy Scale runs from 0 to 42, the MNSI questionnaire counts 13 scored items out of 15 questions, and the standard MNSI examination totals only 4 points. A score of 14 is roughly a third of the way up the UENS range and is not possible at all on the standard MNSI examination. Comparing your number to any figure found online requires knowing which instrument and which portion produced both.
About the Author